This week the government of India has released the long awaited Household Consumption Expenditure Survey (HCES) 2022-23. The survey has covered the whole of the Indian Union except a few inaccessible villages in the Andaman and Nicobar Islands.
Information in the survey has been collected from 8,723 villages and 6,115 urban blocks spread over the entire country covering 2,61,746 households (1,55,014 in rural areas and 1,06,732 in urban areas).
Survey on Household Consumption Expenditure Fact Sheet: 2022-23
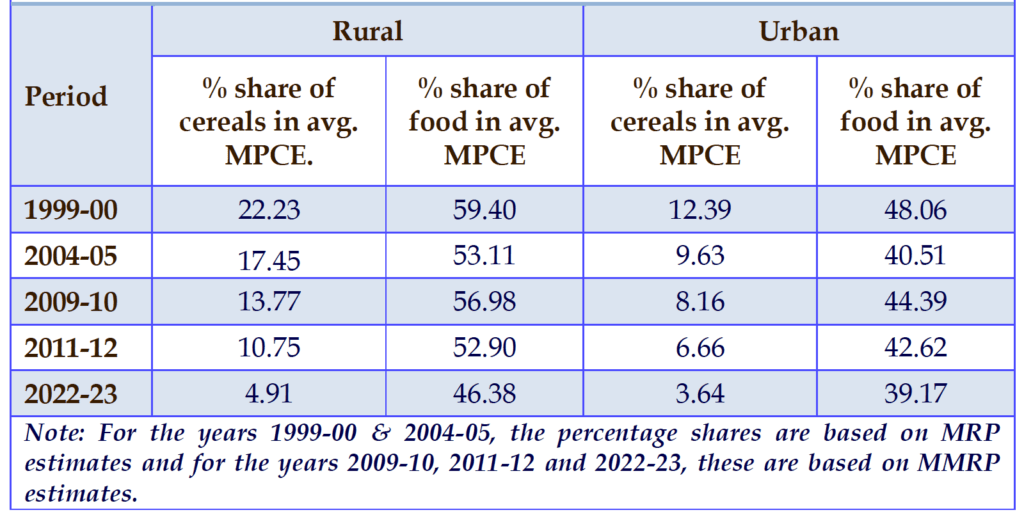
We will scrutinize this survey report with a focus on consumer spending, particularly on food products and, subsequently, milk and its derivatives. Over the last two decades, there has been a consistent decline in the percentage share of Monthly Per Capita Expenditure (MPCE) allocated to food items. This noteworthy trend is discernible in both rural and urban demographics. From an economic perspective, this decline signifies a positive indicator of prosperity. It’s not merely a reduction in the share of spending on food, but also a decline in the proportion of expenditure allocated to cereals within the broader food category.
Advertisement · Scroll to continue
In the realm of non-food categories, a marked surge has been observed in expenditures related to pan, tobacco, intoxicants, conveyance, medical, education, entertainment, consumer services, and durable goods, both in urban and rural areas. Conversely, spending on fuel and light, clothing and bedding, as well as footwear, has experienced a notable decline within the non-food segment.
When it comes to healthy food expenditures, milk and milk products take the lead, closely trailed by vegetables, cereals, fruits, eggs, poultry, and meat, manifesting consistently in both urban and rural settings. However, the less health-conscious category of processed foods and beverages claims the top spot in expenditure for both rural and urban profiles under food spend.
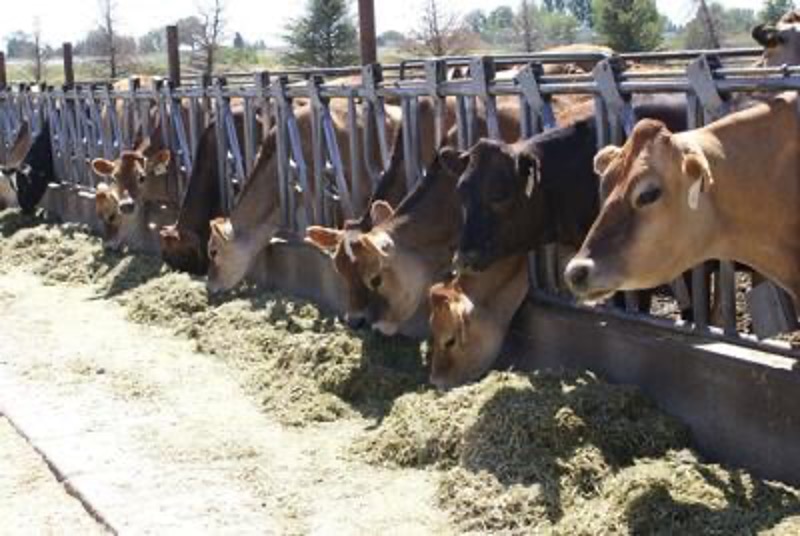
Milk and Milk products – The story unfolds
At times, obtaining precise estimates of per capita consumption for milk and its products proves challenging. NSSO surveys consistently guide analysts to formulate educated approximations of actual demand, relying on per capita monthly expenditure data. Our analytical journey began with an in-depth examination of the data on Monthly Per Capita Expenditure (MPCE) related to milk and milk products spanning from 1999-2000 to the most recent 2022-23 dataset.
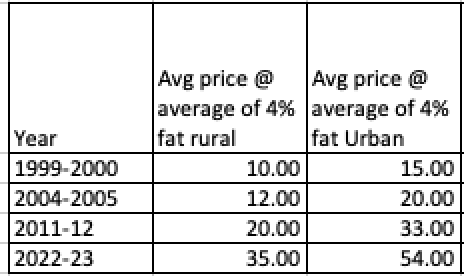
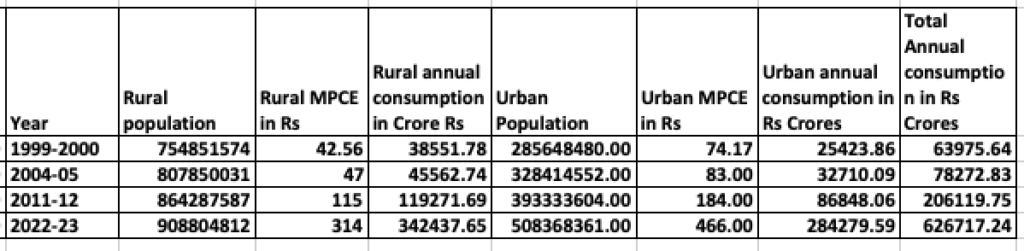
In the initial phase, we computed the total value of dairy consumption across both rural and urban areas. To achieve this, we utilized population data from the years 1999-2000, 2004-2005, 2011-12, and 2022-23. In this comprehensive analysis, we operated under specific assumptions regarding the average milk prices accessible to consumers in both rural and urban areas, considering a standard 4% milk composition.
Then we first try to compute the actual value of milk and milk products consumed on the basis of latest MPCE data of 2022-23 as follows –
This data unequivocally reveals that the aggregate consumption value of milk products stands at approximately 6.26 lakh crores, a figure notably lower than the widely circulated range of 8.5 to 12.5 lakhs across various platforms. In our quest for clarity, we delved deeper to scrutinize the volumetric implications underlying this expenditure figure, utilizing the assumptions outlined earlier. While acknowledging that these assumptions may not be an exhaustive representation of the entire country, we meticulously consulted multiple sources before arriving at these figures.
Milk Production vs Consumption Puzzle
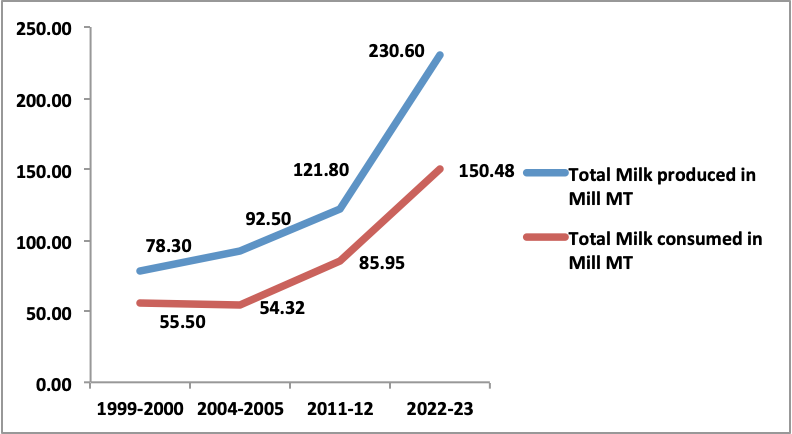
Surprisingly, our investigation brought to light a substantial disparity between the production and consumption of milk and its derivatives. The ensuing chart vividly illustrates this intriguing revelation.
In the fiscal year 2022-23, our nation witnessed the consumption of approximately 65% of the total milk produced. This implies that the remaining 35% could reasonably be attributed to the farmer’s personal consumption. From this initial analysis, two compelling insights emerge.
Firstly, it challenges the prevalent assumption that 50% of the milk is retained by farmers for personal use. Our findings suggest a more accurate estimate lies within the range of 30-35%, significantly lower than the commonly held belief.
Secondly, it raises a critical perspective on the challenges faced by farmers in securing equitable prices for their produce. The surplus in milk supply, as opposed to a deficit in demand, may be a key factor contributing to the farmers’ struggle for fair compensation. Addressing this over-supply dynamic could be pivotal in fostering a more balanced and sustainable dairy economy, ensuring that farmers receive their due share for their hard work and dedication.
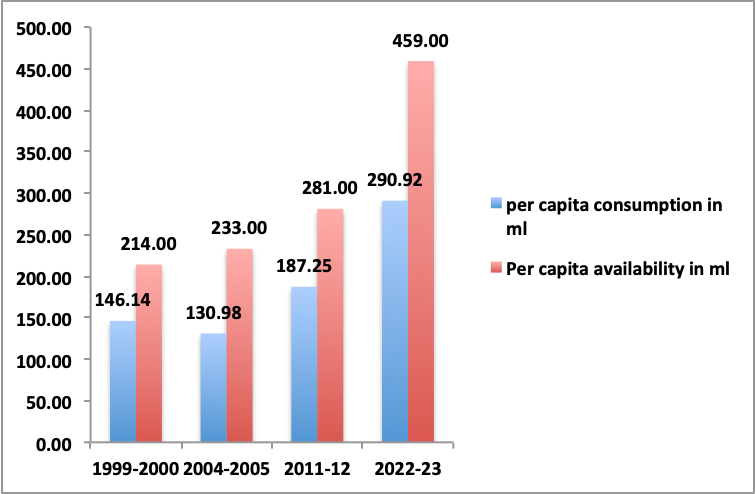
Is our per capita milk consumption meets the recommended guidelines of 250ml ?
We took the analysis further by comparing per capita availability (which is presumed as per capita consumption at times) with the per capita consumption based on the figures derived from MPCE survey.The chart below once again proves our earlier computation of supply exceeding demand.
“In delving into the intricacies of per capita milk consumption, a disquieting reality unfolds. Recent data reveals a significant shift, with our per capita milk intake surpassing the recommended 250 ml levels. This prompts a poignant question: Could this be a contributing factor to our struggle in securing optimal health and nutritional benefits, particularly for our children?
The disconcerting statistics persist as we look at the state of our nation’s children. A staggering 3.25 crore children, representing 39% of those under six years of age across 13.9 lakh anganwadi centers, grapple with stunting. Shockingly, 1.5 crore of these children are underweight. Surprisingly, the World Hunger Index 2023 reports a starkly different figure, indicating 18.7% wasting as opposed to the 6% reported by the Poshan tracker.
As we reflect on these revelations, three critical questions emerge
a. Are we, in fact, overproducing milk, placing undue pressure on every stakeholder in the process?
b. Are we ensuring that milk is made available to everyone and particularly to our children in accordance with recommended dietary guidelines?
c. Does the current valuation of our dairy industry at 6.25 lakh crores truly capture its comprehensive worth?
In anticipation of your valuable guidance and insights, we envision advancing this study to the next level. While our initial analysis relies on the Fact sheet provided by the Ministry of Statistics and Programme Implementation, we are committed to a more exhaustive exploration, with plans to incorporate additional details from the NSSO. Together, let us strive for a more nuanced understanding and the collective improvement of our nation’s dairy landscape.”
Source : Blog by Kuldeep Sharma Chief editor Dairynews7x7.com
All charts and analysis done by Team @suruchi consultants
Sorry, your ID is maybe not correct (If you did not place any ID that means auto-detect does not work.). And please make sure that your selected element is developed with Swiper.