Milk production
Raw milk production of 160.0 million tonnes in 2022, 96 % of which was cows’ milk
The production of raw milk on the EU’s farms was an estimated 160.0 million tonnes in 2022, which would represent a year-on-year decrease of 0.3 million tonnes. This relative stability in the level of EU production can be put in some context by looking at production levels in the run-up to the abolition of quotas; EU farms produced 149.7 million tonnes of raw milk in 2014.
In 2022, the vast majority of raw milk was delivered to dairies; only 9.8 million tonnes was used on farms, either being consumed by the farmer and his family, sold directly to consumers, used as feed or processed directly. Of the 149.9 million tonnes of milk delivered to dairies, 145.6 million tonnes was cows’ milk, the rest being ewes’ milk, goats’ milk or buffalos’ milk (see Figure 1).
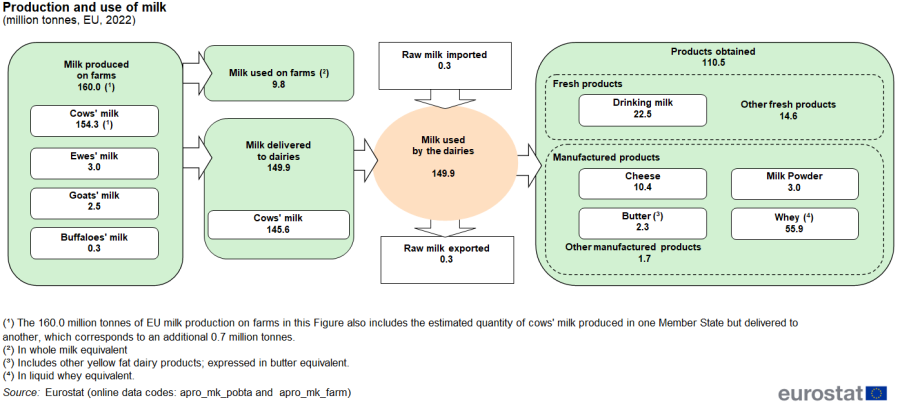
Figure 1: Production and use of milk
(million tonnes, EU, 2022)
Source: Eurostat (apro_mk_pobta) and (apro_mk_farm)
The average apparent milk yield per cow across the EU still rising
There are a number of factors that can impact on a countries’ apparent annual milk yields per dairy cow, including the structure of the dairy herd. In the EU, the apparent annual milk yield continued to rise, reaching 7 653 kg per dairy cow in 2022. As a national average, apparent annual yields were highest in Denmark (10 187 kg per cow) and Estonia (10 128 kg per cow) and lowest in Bulgaria (3 621 kg per cow) and Romania (3 367 kg per cow). Among the main cows’ milk producing Member States, apparent yields were above the EU average in the Netherlands and Germany but slightly below average in France, Poland and Italy.
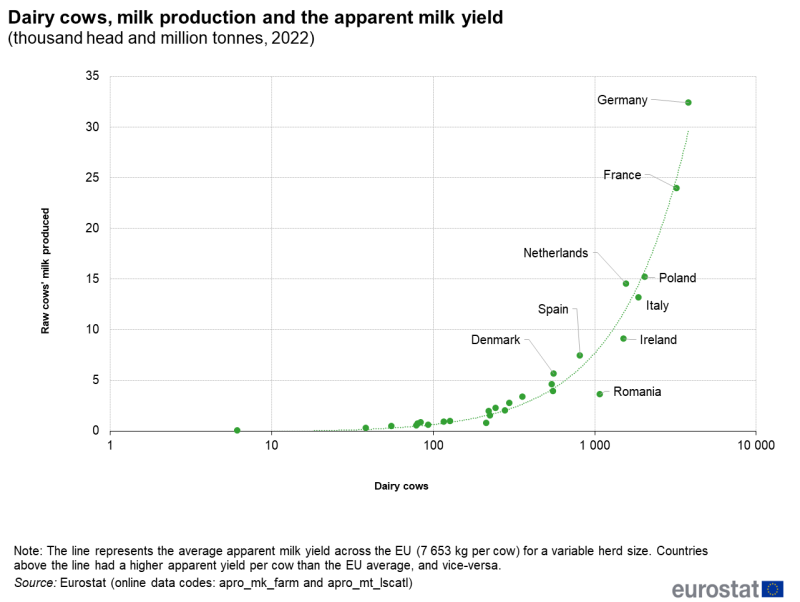
(million tonnes and thousand head, 2022)
Source: Eurostat (apro_mk_farm) and (apro_mt_lscatl)
One fifth of the EU’s cows’ milk was collected by dairies in Germany
Traditionally, hygiene rules have required that the collection of milk has been frequent and moved over a short distance between farms and dairies. However, the development of cooling tanks on farms and of bigger milk tankers have made this sanitary issue less critical. Meanwhile, the erosion of market restrictions has contributed to cross-border milk flows between farms and dairies or between dairies.
In 2022, a little more than one fifth (21.1 %) of the EU’s raw cows’ milk was produced on farms in Germany and a similar proportion (22.0 %) was processed by German dairies. Indeed, just as Germany, France, Poland, the Netherlands and Italy together provided about two thirds (64.7 %) of the EU’s raw cows’ milk in 2022, so they also accounted for two thirds (66.0 %) of the cows’ milk collected by dairies (see Figure 3).
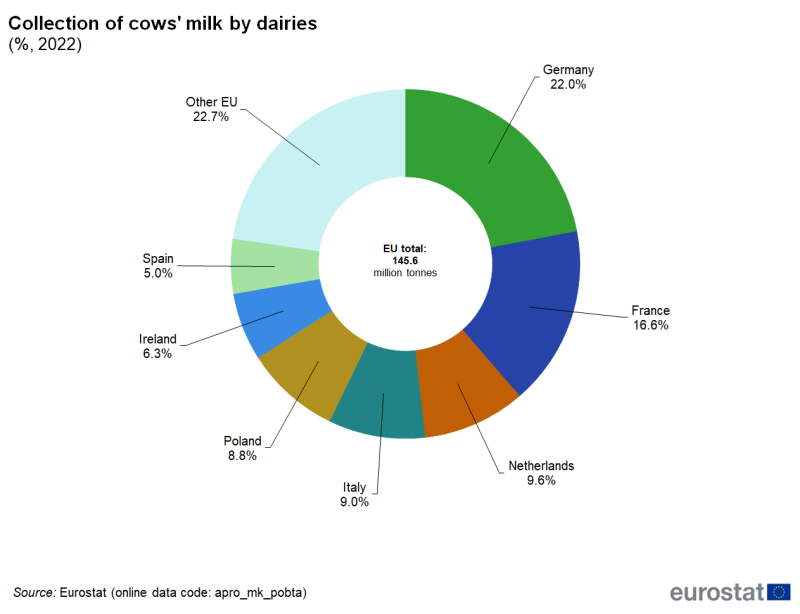
Figure 3: Collection of cows’ milk by dairies, 2021
(% of EU total, tonnes)
Source: Eurostat (apro_mk_pobta)
There are a few EU Member States where livestock other than cows make an important contribution to overall milk production; this is the case in many rural or arid regions, particularly in the Mediterranean area. In 2022, Spain produced 1.1 million tonnes of milk from ewes and goats, with Greece producing 0.9 million tonnes and France 0.8 million tonnes. Italy produced 0.7 million tonnes of milk from animals other than cows and this included almost all of the EU’s production of milk from buffaloes.
Cows’ milk accounts for the vast majority of the milk delivered to dairies across most of the EU Member States. Nevertheless, a majority (57.7 %) of the milk delivered to dairies in Greece in 2022 came from ewes and goats, as did about one fifth (21.1 %) in Cyprus (see Figure 4).
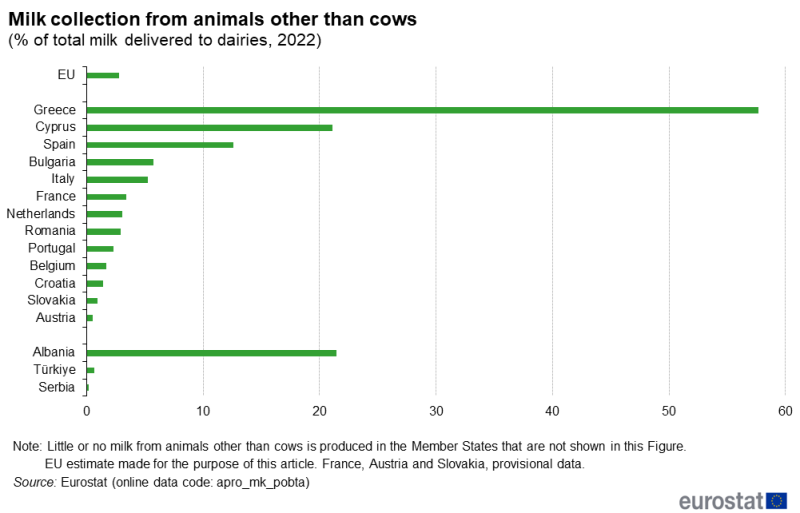
Figure 4: Milk collection from animals other than cows
(% of total milk delivered to dairies, 2022)
Source: Eurostat (apro_mk_pobta)
Acceleration of milk price rises in 2022
There was a strong and steady rise in the price of milk paid to farmers through 2022, with the average price over the year being 35.1 % higher than the average in 2021. This represented an acceleration in higher prices, as the average in 2021 was 7.2 % more than the average price for milk in 2020. These latest changes have accentuated the sharp fluctuations in the average price of milk previously noted (see Figure 5).
Among the principal milk-producing Member States, there were even stronger-than-average rises in the price of milk in 2022 in the Netherlands (+47.0 %), Poland (+46.9 %), Ireland (+44.9 %), and Germany (+44.8 %). Milk prices were higher in every Member State in 2022 compared to 2021, as they were in turn compared to 2020.
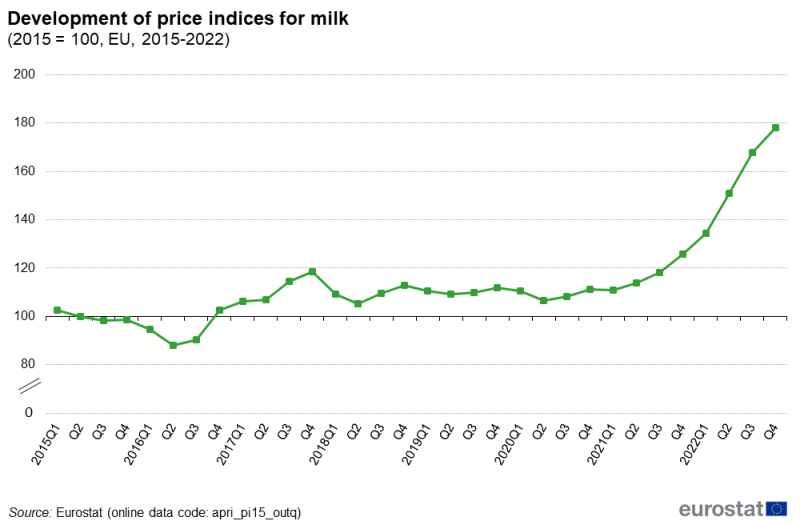
Figure 5: Development of price indices for milk
(2015 = 100, EU, 2015-2022)
Source: Eurostat (apri_pi15_outq)
Milk products
70 % of all whole milk available to dairies in the EU is used to make cheese and butter
The milk delivered to dairies is processed into a number of fresh and manufactured products. Dairy products are recorded in terms of their weight. It is thus difficult to compare the quantities of various products (for example, tonnes of fresh milk and of milk powder). The volume of whole or skimmed milk used in dairy processes provides more comparable figures [1].
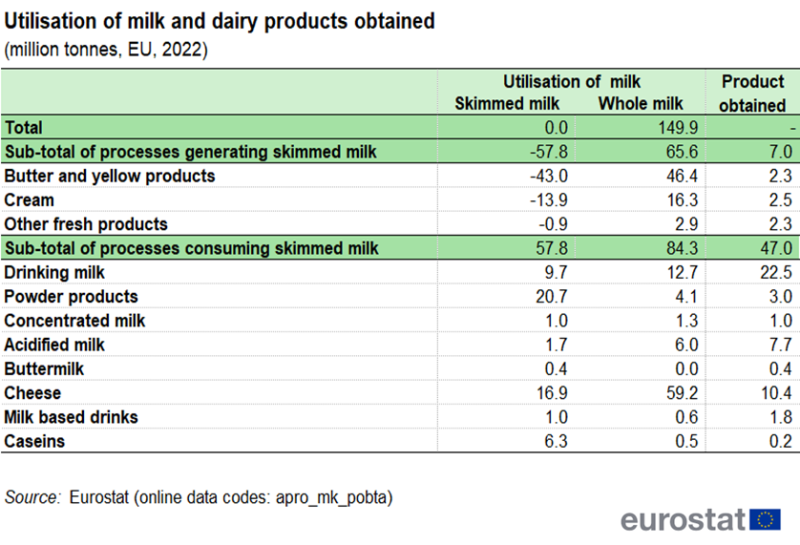
In 2022, 149.9 million tonnes of the whole milk available to the EU’s dairy sector was processed.
The production of 2.3 million tonnes of butter and so-called ‘yellow products’ (such as butteroil and rendered butter) in the EU in 2022 required 46.4 million tonnes of whole milk (see Table 1). The production of butter and yellow products also generated 43.0 million tonnes of skimmed milk. A further 13.9 million tonnes of skimmed milk were generated through the fabrication of cream and 0.9 million tonnes from other fresh products. The skimmed milk generated were used with 84.3 million tonnes of whole milk for the processing of other dairy products.
Indeed, 16.9 million tonnes of skimmed milk together with 59.2 million tonnes of whole milk were used to produce 10.4 million tonnes of cheese in the EU in 2022. Together, the production of cheese and butter used 70.4 % of all the whole milk available to dairies in the EU.
Table 1: Utilisation of milk and dairy products obtained
(million tonnes, EU, 2022)
Source: Eurostat (apro_mk_pobta)
The EU also produced 22.5 million tonnes of drinking milk, from 9.7 million tonnes of skimmed milk and 12.7 million tonnes of whole milk. Drinking milk accounted for 8.5 % of all the whole milk used by dairies in 2022.
In 2022, 3.0 million tonnes of dairy powder products were produced in the EU from 20.7 million tonnes of skimmed milk and 4.1 million tonnes of whole milk.
Germany produced about one-fifth of the EU’s drinking milk (19 %), butter (20 %) and cheese (22 %) in 2022. The other main cheese producing Member States were France (a provisional 1.9 million tonnes, about 18 % of the EU total), and Italy (1.4 million tonnes, about 13 % of the EU total). The Netherlands had the second highest level of production for whey (about 15 % of the EU total) and the fourth highest for cheese (about 9 % of the EU total), while Ireland accounted for the third highest share of butter produced (about 13 % of the EU total).
Source data for tables and graphs
Data sources
Milk and milk product statistics
Milk and milk product statistics are collected under Decision 1997/80/EC and implementing Directive 1996/16/EC. They cover farm production and the utilisation of milk, as well as the description (structure), collection and production activity of dairies. Due to the small number of dairy enterprises, national data are often subject to statistical confidentiality. Thus, providing EU totals in this context is a challenge and some of the information presented in the analysis is based on partly provisional data. On the one hand, statistics from these few enterprises provide early estimates on trends. On the other hand, a complete overview of the dairy sector requires detailed information from farms and this means that the final figures on milk production are only available at an EU level about one year after the reference year.
Dairy products are recorded in terms of weight. It is thus difficult to compare the various products (for example, fresh milk and milk powder). The volume of whole or skimmed milk used in the dairy processes provides more comparable figures.
Livestock statistics
The number of dairy cows used in the analysis was drawn from the livestock population in November/December 2021.
Agricultural price statistics
EU agricultural price statistics are based on voluntary agreements between Eurostat and the Member States. National statistical institutes or Ministries of Agriculture are responsible for collecting absolute prices and calculating corresponding average prices for their country, as well as for calculating price indices and periodically updating the weights. Price indices are reported quarterly and annually. Absolute prices are reported annually. The agricultural prices expressed in national currency are converted into euro by Eurostat using fixed exchange rates or financial market exchange rates in order to allow comparisons between the EU Member States. Eurostat is responsible for calculating indices for the EU.
Context
The abolition of milk quotas in 2015 resulted in a restructuring and further modernisation of the sector, including a re-orientation towards the most productive herds, more intense cross-border milk flows and increased production. Over recent years, milk prices have followed the global milk fat market.
There is no ‘typical’ European dairy cow breed, though the Friesian-Holstein is prevalent.
Notes
- ↑ Two dimensions (quantities of whole and skimmed milk used) reflect the material balance of the valuable milk components, especially fat (in whole milk only) and protein (in total milk used).


